

Description
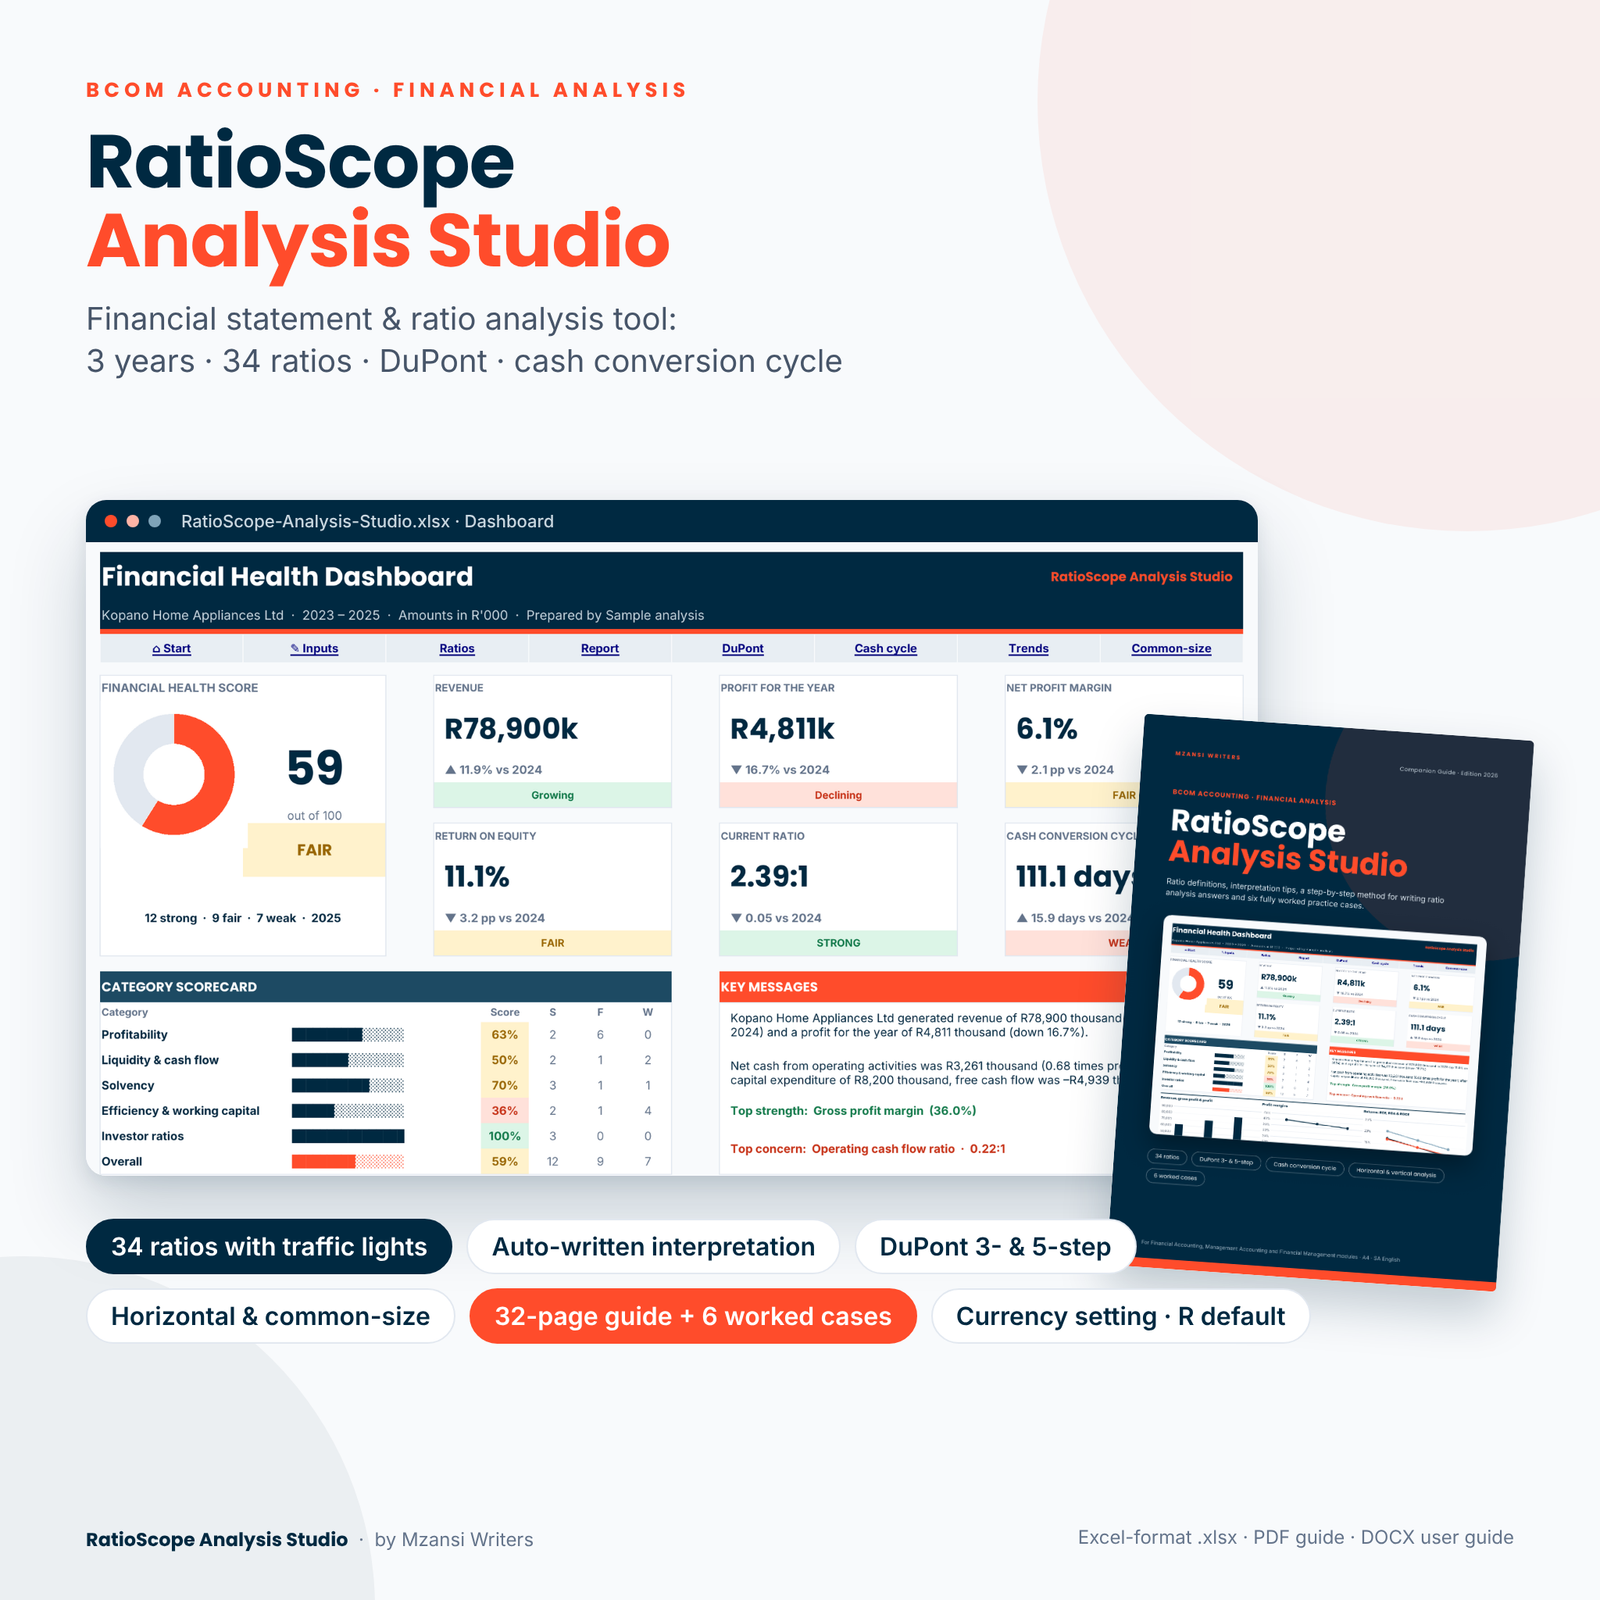
RatioScope Analysis Studio is a ratio analysis Excel template and study kit for BCom Accounting students. Type in up to three years of financial statements and it calculates 34 financial ratios, rates each one against benchmarks you can edit and then writes a plain-English interpretation, so you can spend your study time on what earns the marks: explaining the numbers.
It covers the analysis and interpretation topics that appear in Financial Accounting, Management Accounting and Financial Management modules. That includes profitability, liquidity, solvency, working capital, investor ratios, DuPont analysis, the cash conversion cycle, and horizontal and vertical analysis.
What the ratio analysis Excel template does
You enter the statement of profit or loss, the statement of financial position, the statement of cash flows and the share data once. Every sheet, chart and sentence then updates automatically:
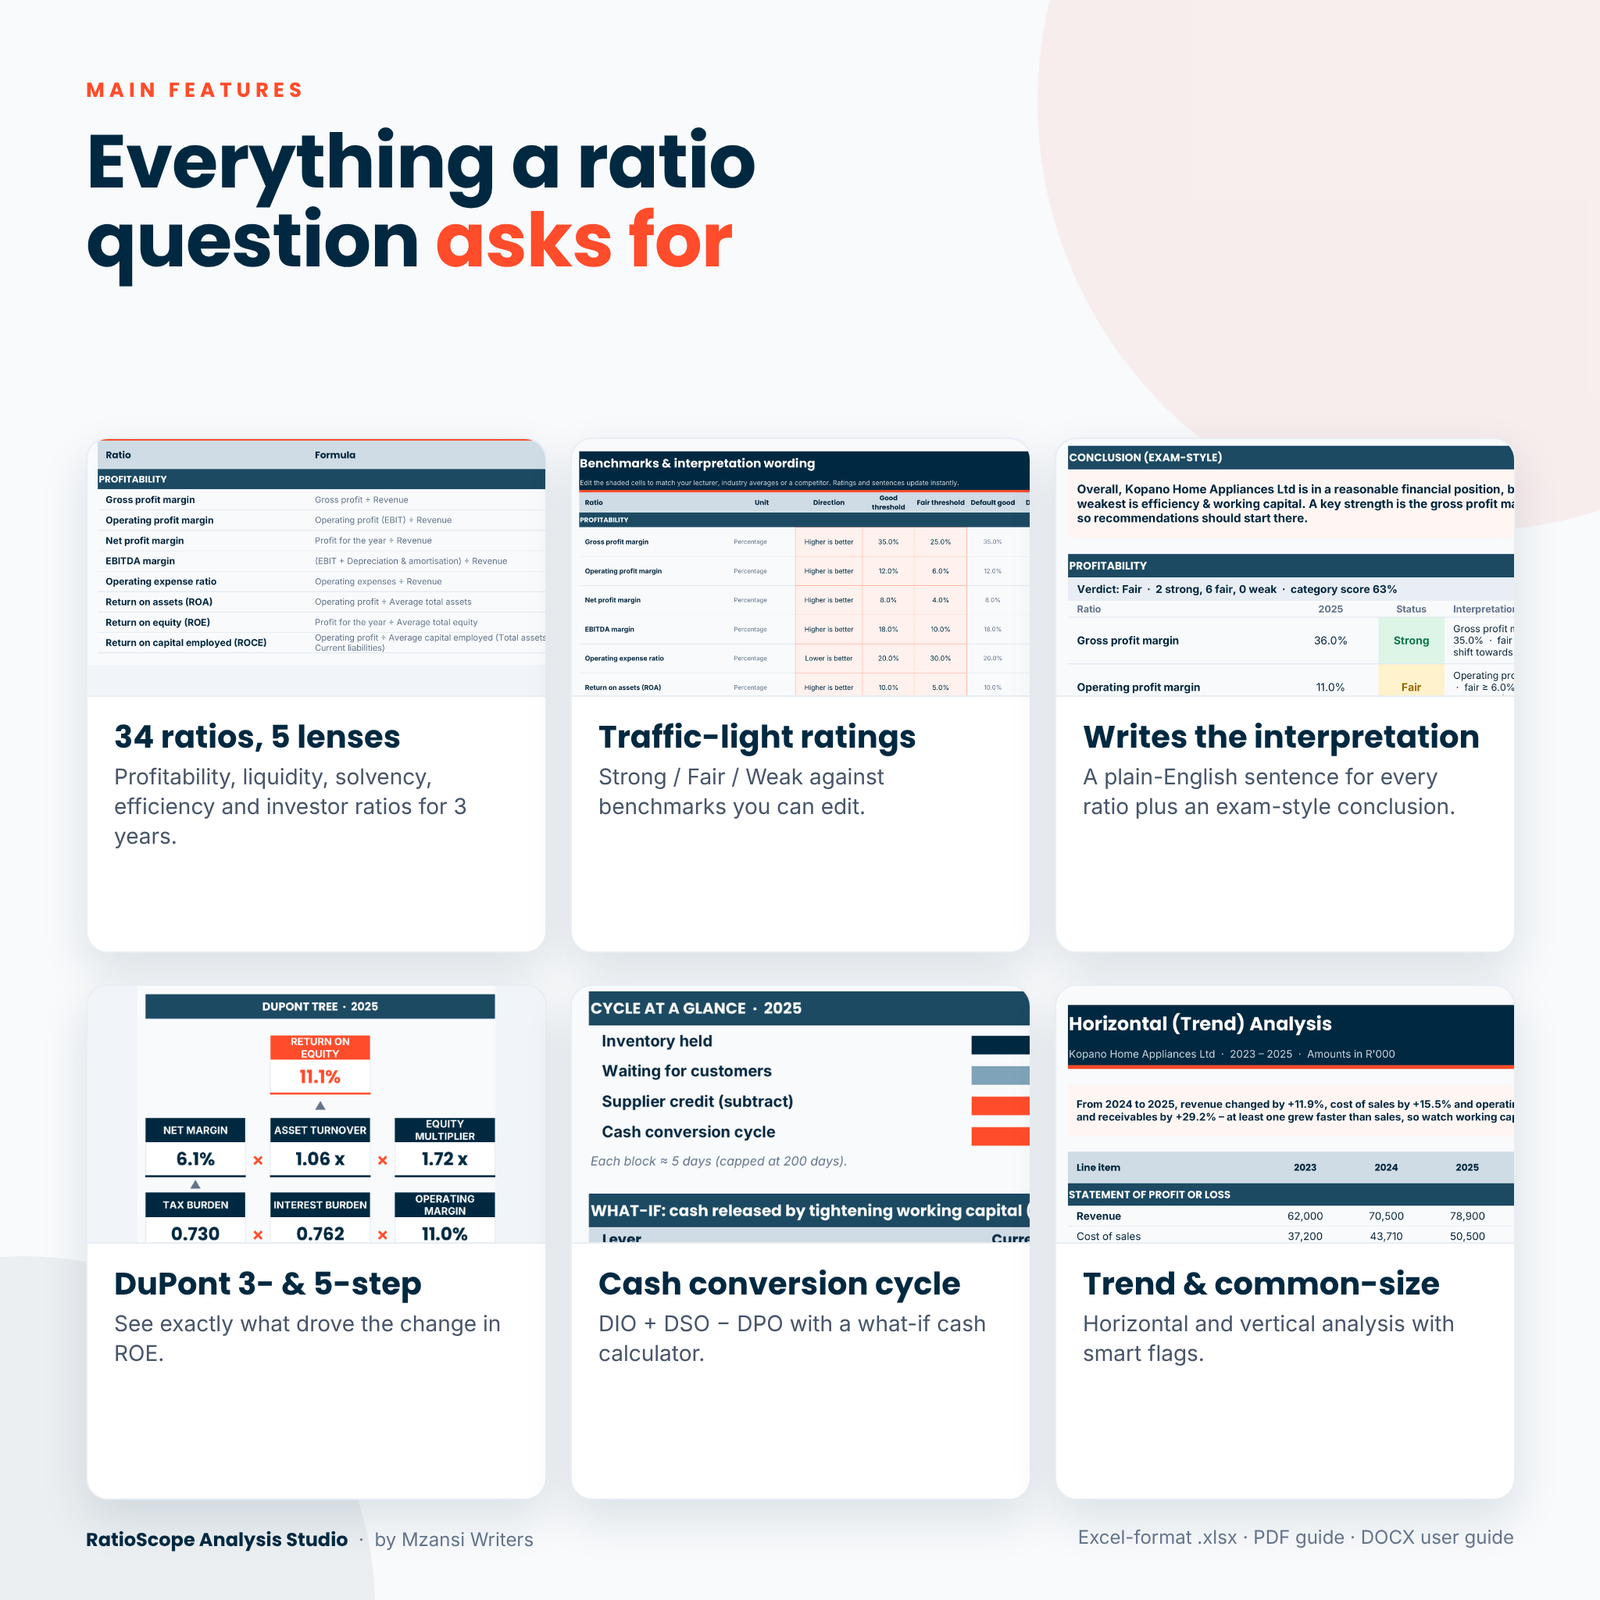
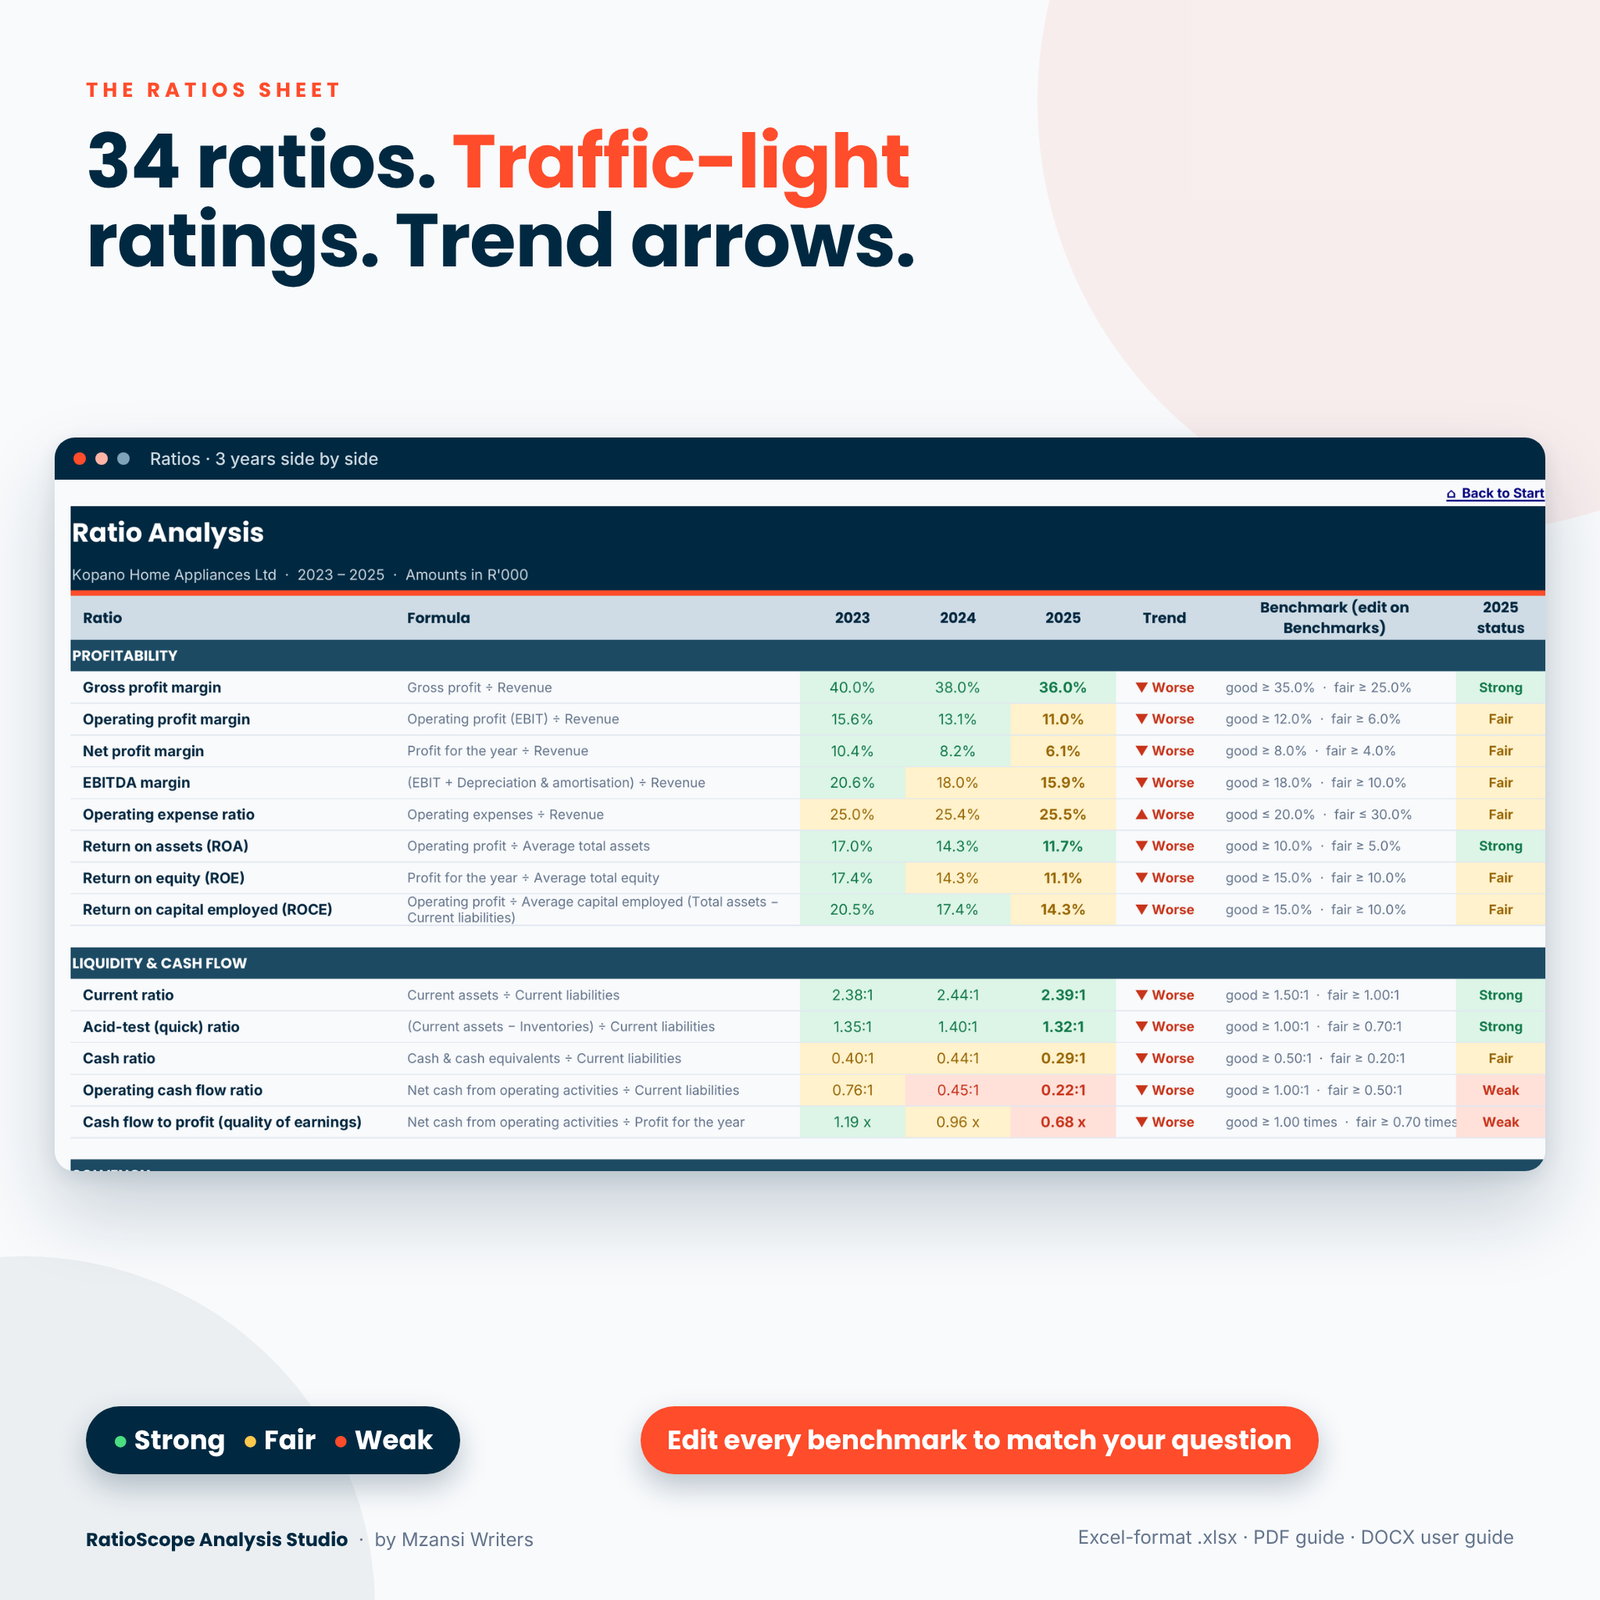
- 34 ratios in five categories: profitability, liquidity and cash flow, solvency, efficiency and working capital, and investor ratios. Each has its formula shown and three years side by side.
- Traffic-light ratings: each ratio is rated Strong, Fair or Weak against its benchmark, and ▲ Better / ▼ Worse arrows show the trend.
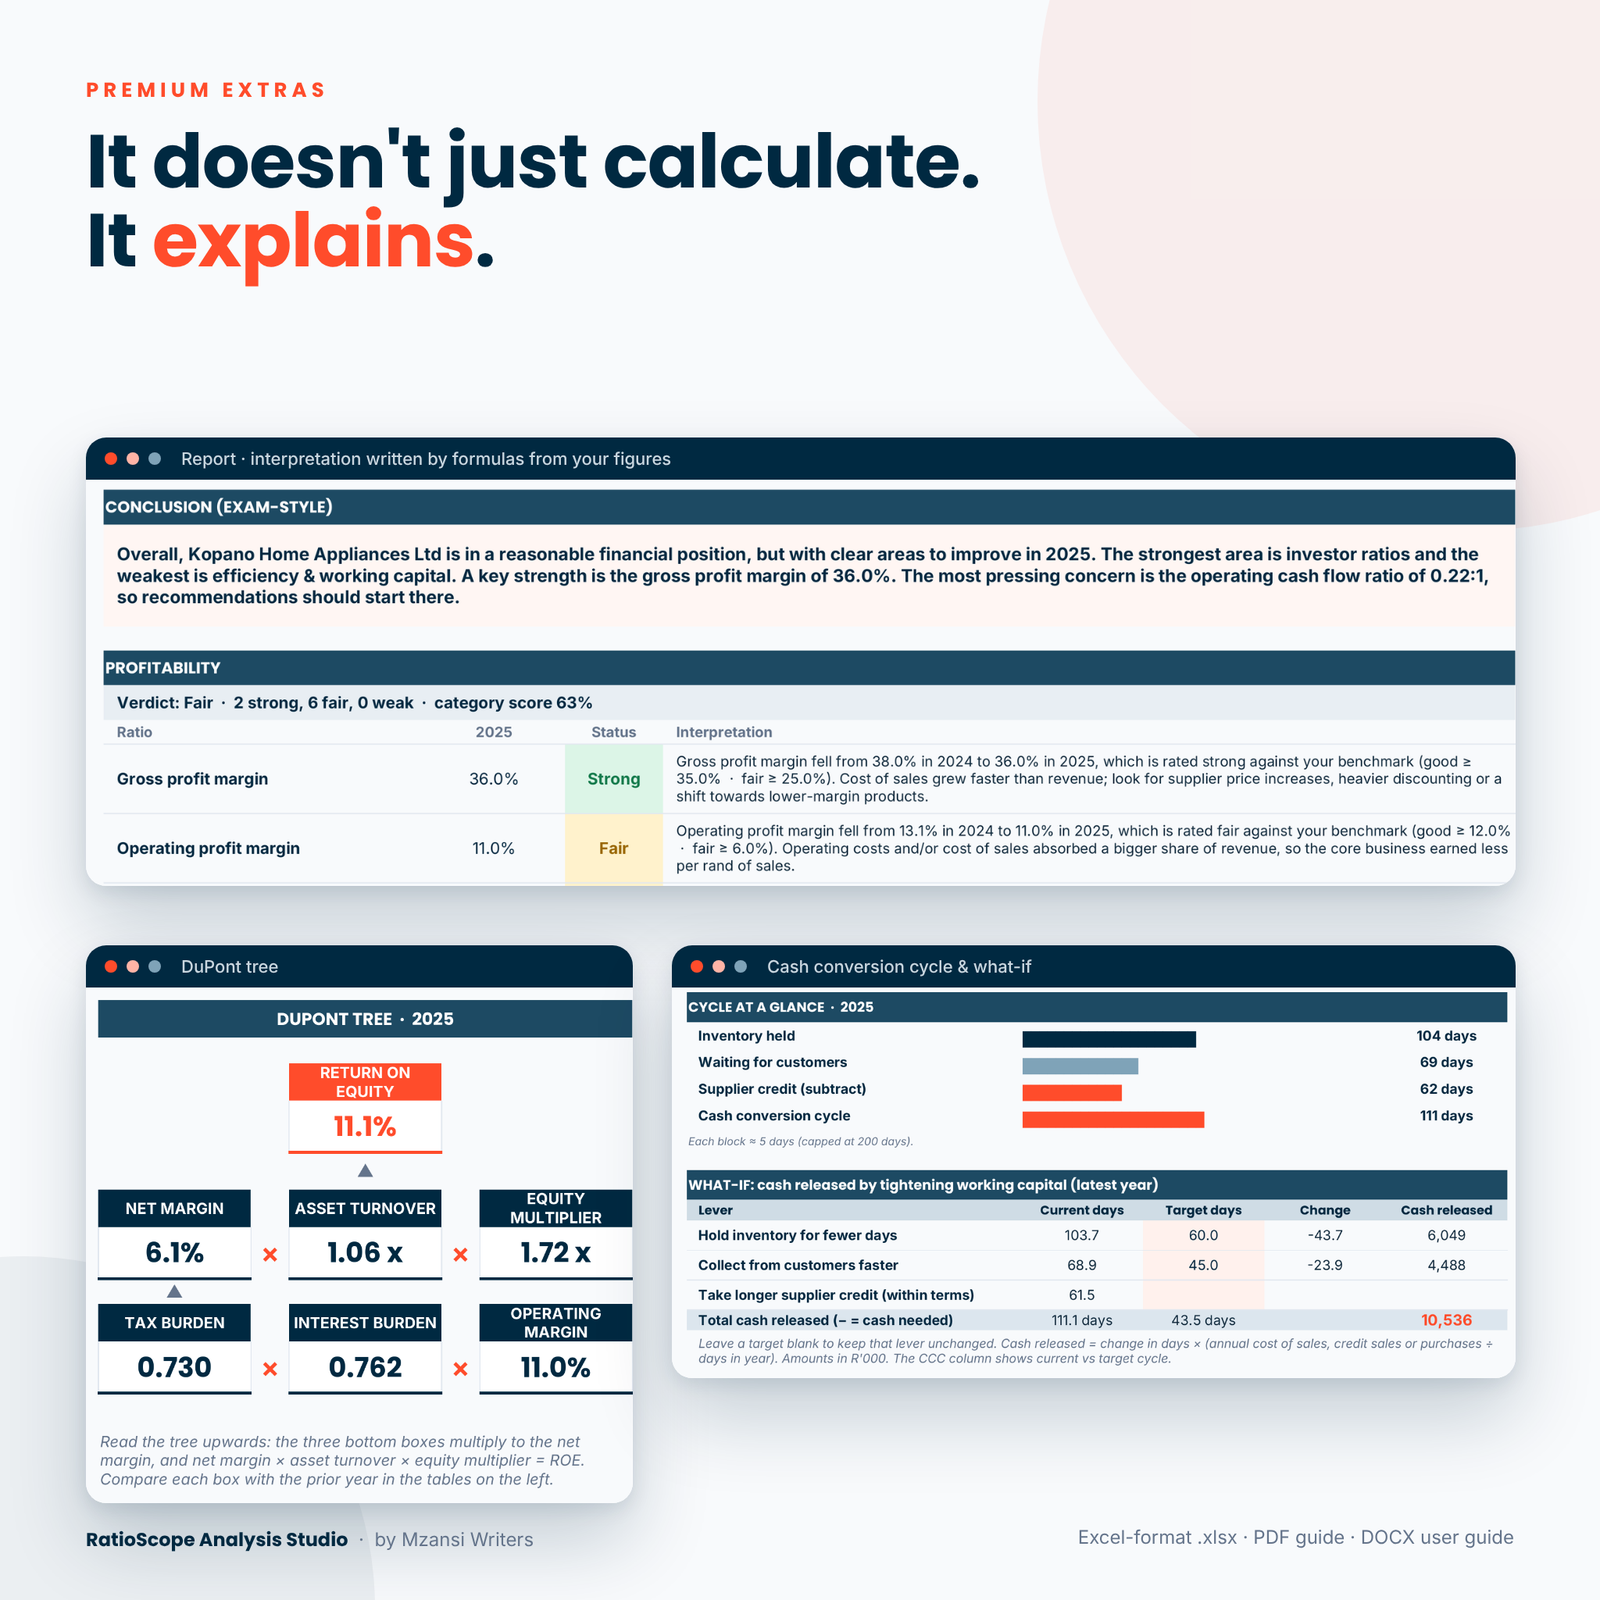
- Auto-written interpretation: a sentence for every ratio that gives the movement, the rating and a likely cause, plus strengths, concerns and an exam-style conclusion.
- DuPont analysis: 3-step and 5-step ROE breakdowns with reconciliation checks, a visual DuPont tree and a sentence that names the biggest driver.
- Cash conversion cycle: inventory, receivables and payables days, plus a what-if table that shows how much cash would be released by hitting target days.
- Horizontal and common-size analysis: year-on-year changes, a trend index, favourable/unfavourable flags and each line as a percentage of revenue or total assets.
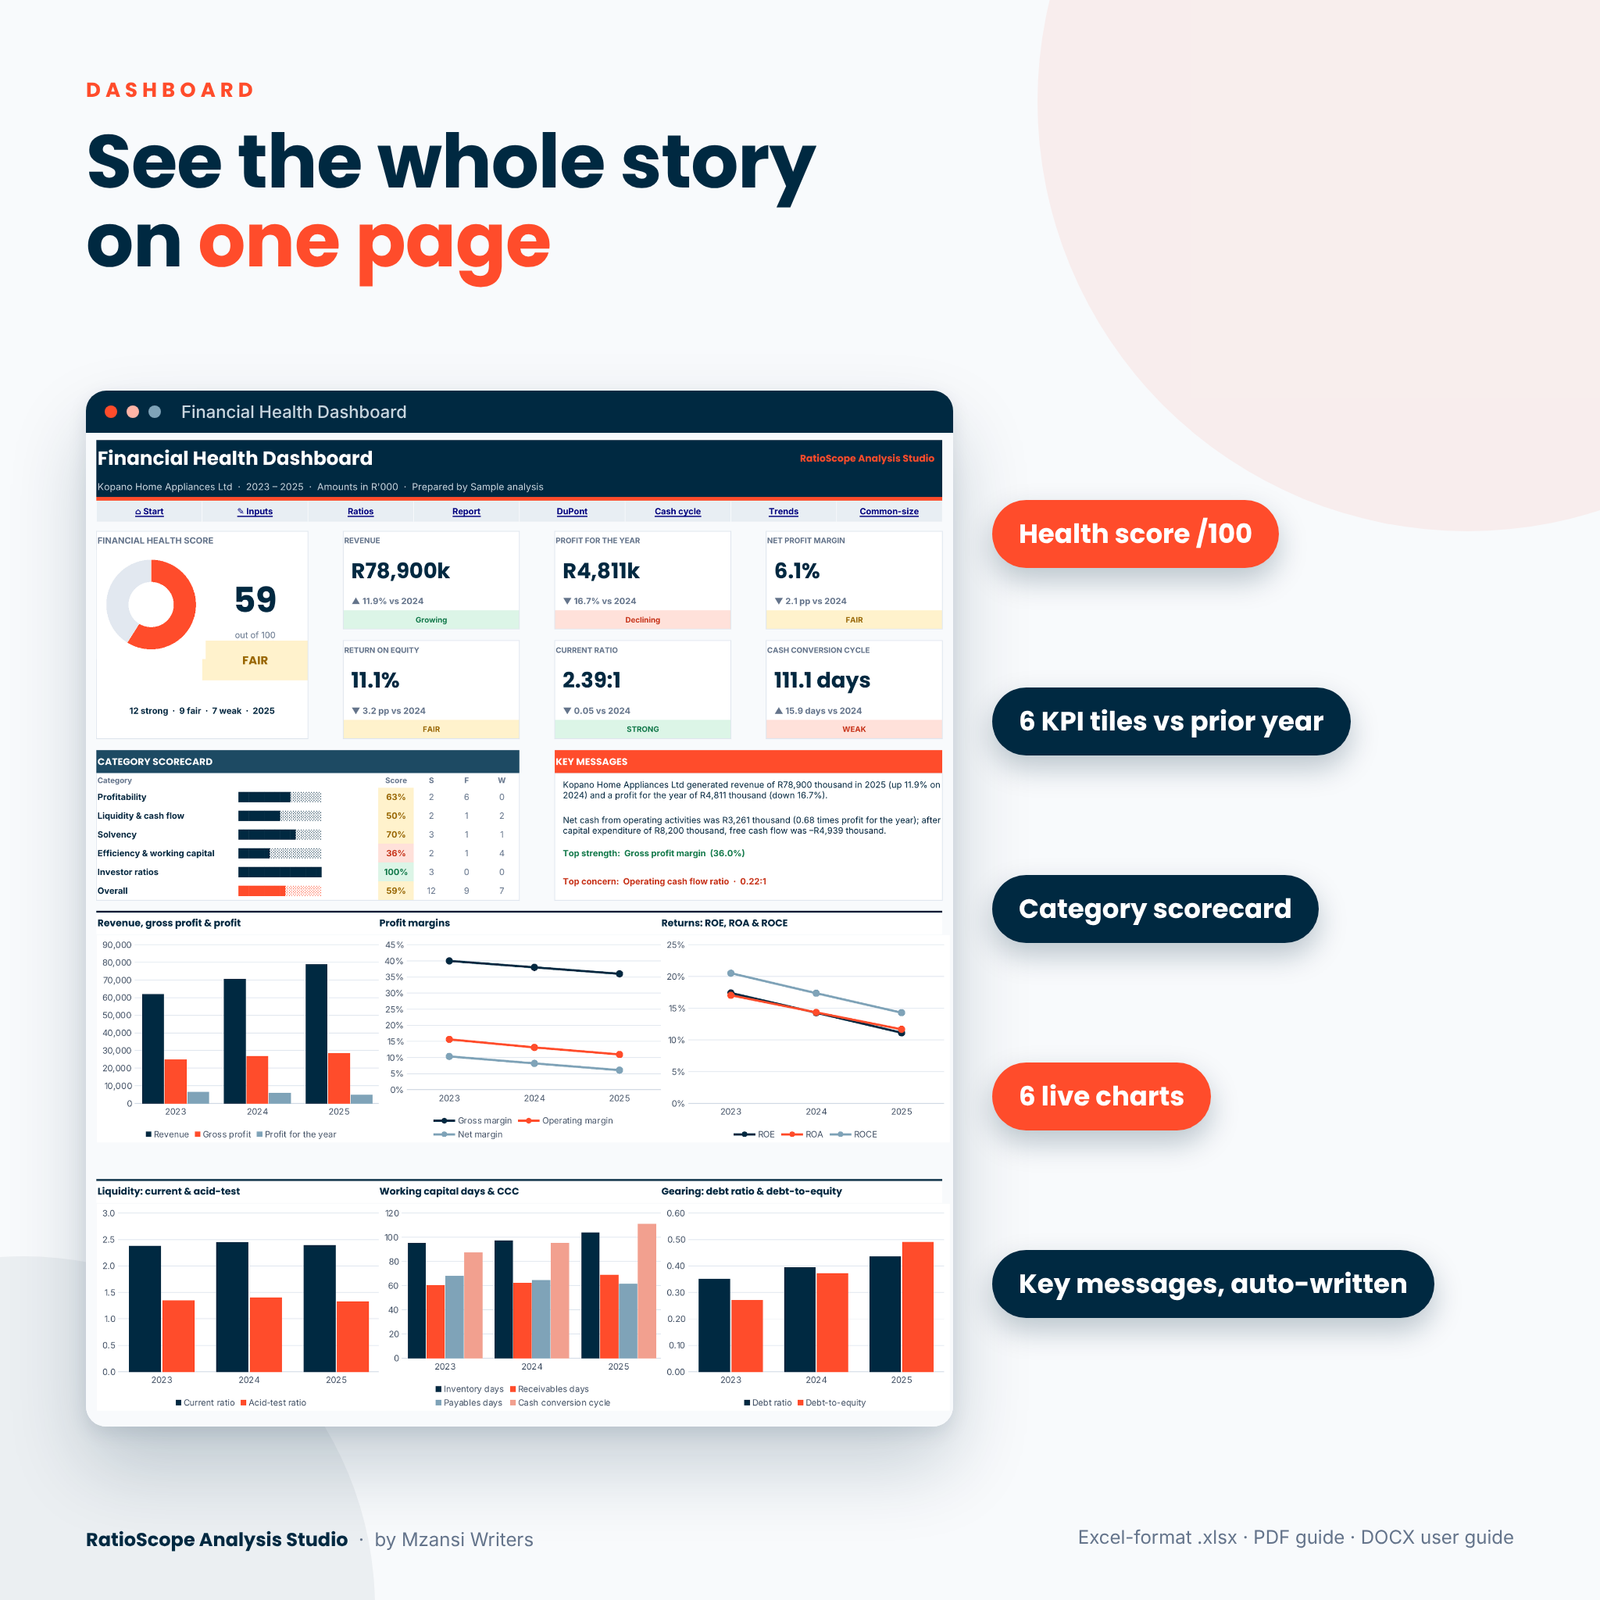
- Financial health dashboard: a score out of 100, six KPI tiles, a category scorecard, key messages and six native charts.
Who it is for
It is for BCom Accounting, BCompt and BAcc students who need to analyse and interpret financial statements, and for Management Accounting and Financial Management students who work with DuPont, working capital and the cash conversion cycle. Tutors can use it to check answers and generate examples quickly. No advanced Excel skills are needed: you only type in the shaded cells.
Main benefits
- Check your answers instantly. Work a question by hand, enter the figures and compare. The Workings sheet shows every average and intermediate figure.
- Learn to write better answers. The generated sentences and the guide’s CLEAR method (Calculate, Look, Explain, Assess, Recommend) show you how a strong interpretation is built.
- Fewer input errors. A balance check, a cash flow reconciliation and DuPont checks flag mistakes before you rely on the results.
- Quantified recommendations. The what-if calculator turns “collect debtors faster” into a cash amount.
What is included
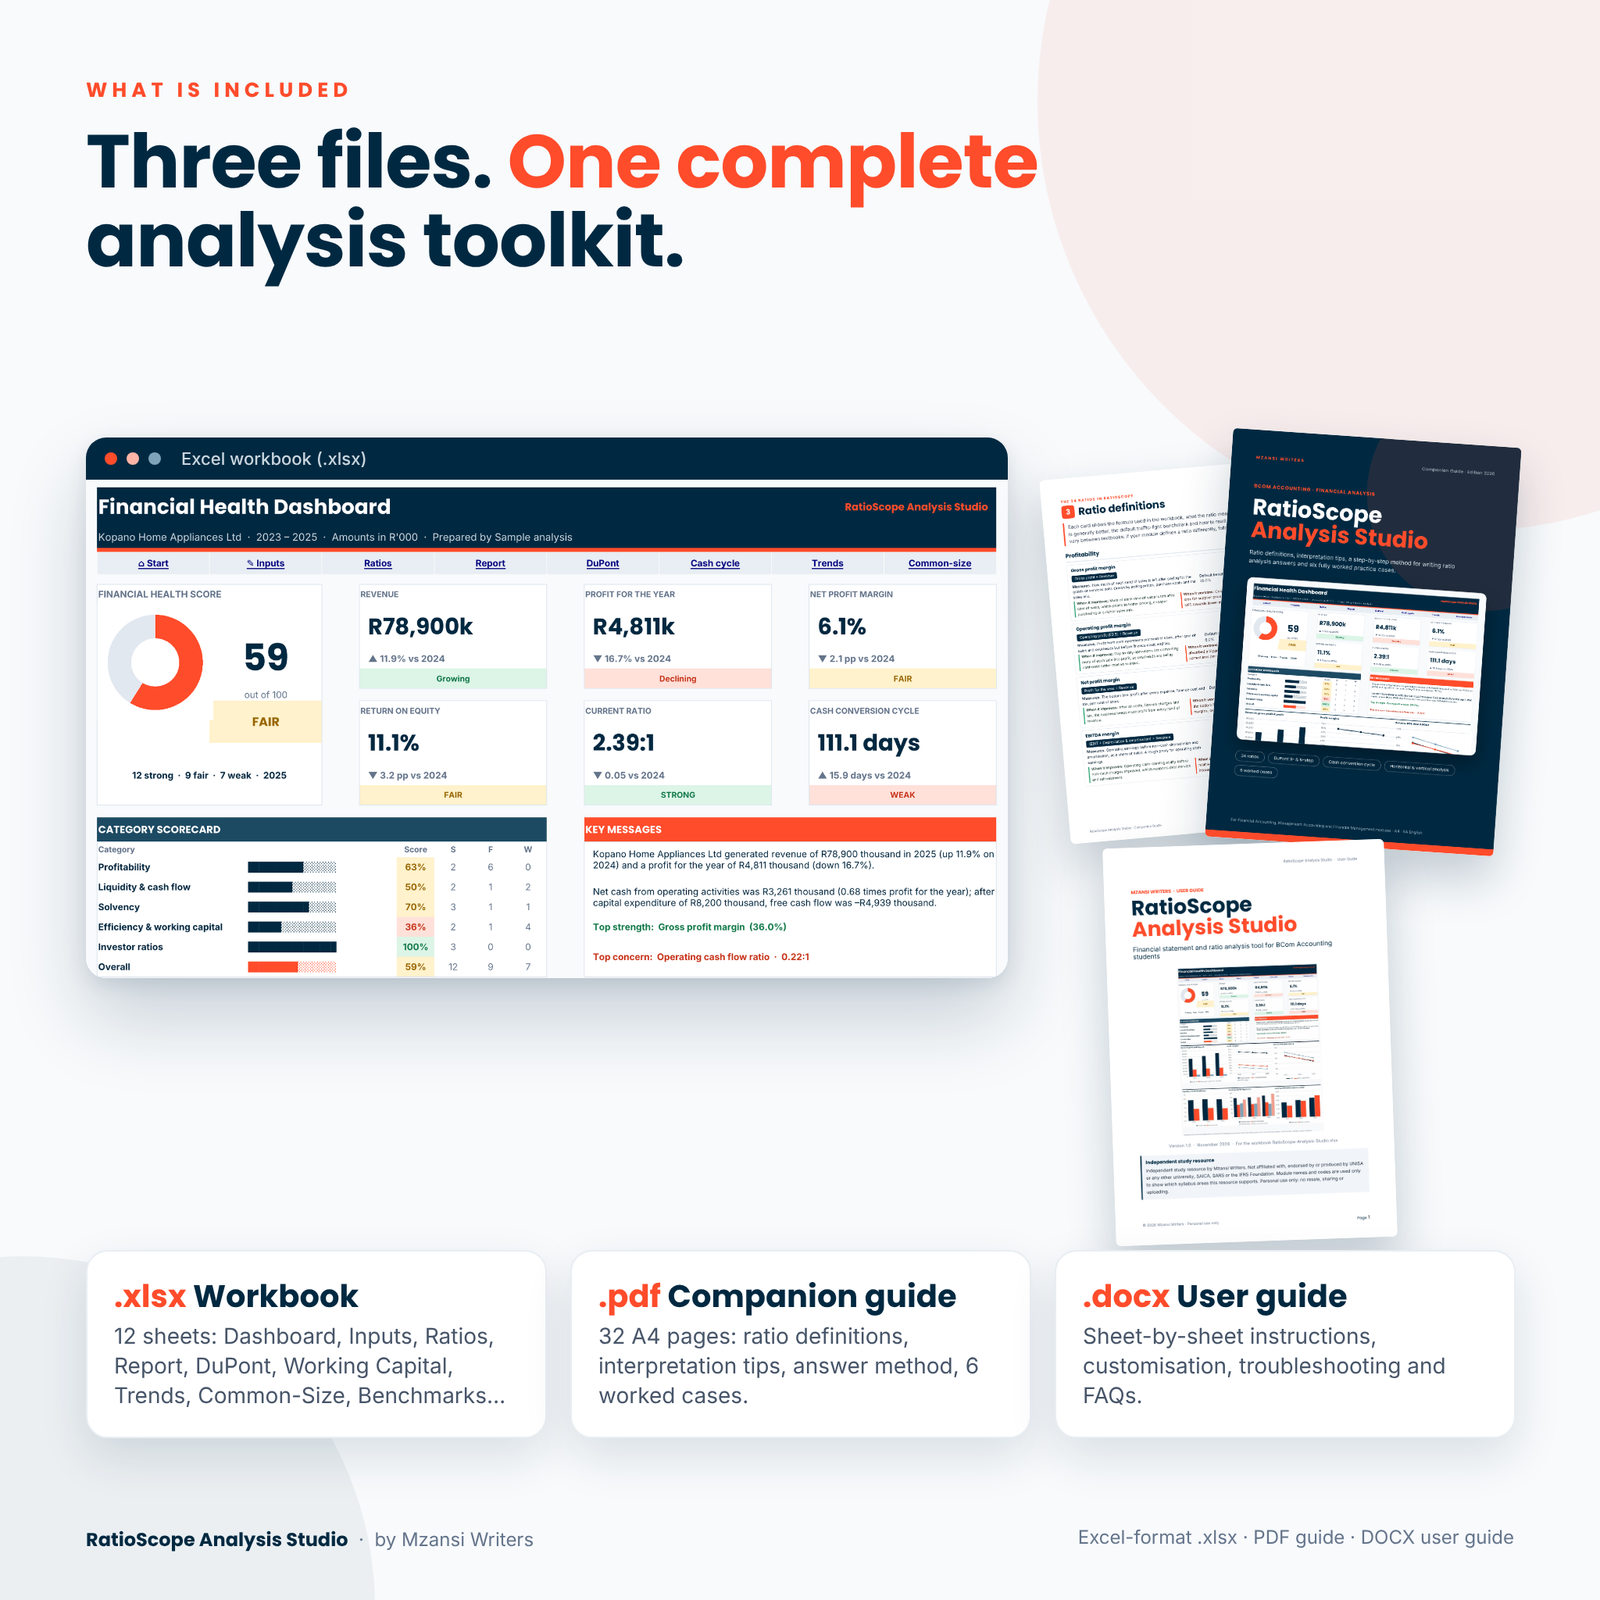
1. RatioScope-Analysis-Studio.xlsx (the workbook)
The workbook has 12 visible sheets: Start, Dashboard, Settings, Inputs, Ratios, Report, DuPont, Working Capital, Horizontal, Common-Size, Benchmarks and Workings. It is supplied clean, ready for your own figures.
2. RatioScope-Companion-Guide.pdf (32 pages, A4)
The guide covers ratio definitions with interpretation notes, the analyst’s toolkit, a cause-and-effect interpretation map, how to write a ratio analysis answer (with a model paragraph, phrase bank and exam checklist), six original practice cases with full worked solutions, and a one-page formula sheet. Every case figure was cross-checked by script: each statement of financial position balances, each cash flow statement reconciles and every ratio was recalculated independently. The contents page and section links are clickable.
3. RatioScope-User-Guide.docx
Step-by-step instructions for every sheet, plus customisation, tips, troubleshooting and FAQs.
How it works
- Settings: enter the company name, currency symbol (R by default), units (units, thousands or millions) and year labels.
- Inputs: enter up to three years of statements. Opening balances are optional and give true averages.
- Check: confirm the balance check shows a tick for every year.
- Analyse: read the Dashboard, Ratios, Report, DuPont, Working Capital, Horizontal and Common-Size sheets.
- Customise: replace the default benchmarks with industry or competitor figures from your question.
File formats and software requirements
- Excel-format .xlsx workbook. Tested in LibreOffice Calc and built with standard functions for Microsoft Excel (2016 or later) and Google Sheets. No macros or add-ins.
- PDF companion guide (A4, fonts embedded, clickable contents).
- DOCX user guide (Microsoft Word, LibreOffice Writer or Google Docs).
- A computer or laptop is recommended for entering data.
Customisation
A single setting controls the currency symbol on every label and sentence, so the tool works for rand or any other currency. You can choose average or year-end balances and a 365- or 360-day year. On the Benchmarks sheet you can edit each ratio’s good and fair thresholds, its direction and its interpretation wording. Sheets are protected without a password, so formulas are safe but you can still unprotect a sheet if you want to change the layout.
Digital download
This is a digital product: nothing is posted. After payment you can download the workbook, the PDF companion guide and the DOCX user guide immediately.
Use cases
- Checking your answers to tutorial and textbook ratio questions before a test.
- Preparing an assignment that analyses a listed company’s annual report.
- Practising full report-style exam questions with the six worked cases.
- Showing a study group how DuPont analysis explains a change in ROE.
- Quantifying working capital recommendations with the cash conversion cycle what-if table.
Frequently asked questions
Does this ratio analysis tool work in Google Sheets?
It is built with standard functions that Google Sheets supports. Upload the .xlsx to Google Drive and open it with Google Sheets. Sheet protection may not carry over.
Can I analyse only two years?
Yes. Leave Year 1 empty and enter the two years in the Year 2 and Year 3 columns.
Which ratios are included?
34 ratios: gross, operating, net and EBITDA margins, the operating expense ratio, ROA, ROE, ROCE, current, acid-test, cash and operating cash flow ratios, cash flow to profit, debt ratio, debt-to-equity, equity multiplier, interest cover, cash flow to debt, asset and fixed asset turnover, inventory turnover, inventory, receivables and payables days, the cash conversion cycle, EPS, DPS, payout ratio, dividend yield, P/E, earnings yield, dividend cover, NAV per share and price-to-book.
Are the benchmarks official industry averages?
No. The defaults are general teaching rules of thumb. Replace them with the comparison figures your question gives.
My textbook defines a ratio differently. What should I do?
Definitions vary slightly between textbooks. Every formula is shown on the Ratios sheet, and you can switch between average and year-end balances. Always follow your module’s definitions.
Is the sample company in the screenshots included?
No. The screenshots use a fictional sample company, and your workbook comes clean. The companion guide gives you six realistic cases to practise with.
Can I share it with friends?
No. The licence covers personal use by the purchaser only. You may not resell, share, distribute or upload the files.
Independent study resource by Mzansi Writers. Not affiliated with, endorsed by or produced by UNISA or any other university, SAICA, SARS or the IFRS Foundation. Module names and codes are used only to show which syllabus areas this resource supports. Licence: personal use only, with no resale, sharing or uploading.



Reviews
There are no reviews yet.